Ancient Sub-Saharan Africa Ancestry Report

Download PDF creates a visual, rasterized copy. Use Print for selectable text and better assistive-technology support.

Ancient Sub-Saharan Africa Heritage

Analyzing your genetic similarity to ancient African populations...

Preparing your genetic-similarity report

Skip to main content
Ancient Sub-Saharan Africa DNA Analysis

Your Ancient Sub-Saharan Africa Heritage

(SSUAJF) Demo Report

Your Closest Matches Are Genetically Distant

We compared your DNA to every sample in our Ancient Sub-Saharan Africa reference panel and ranked the closest ones for you below. Your nearest matches are quite distant, which suggests your primary ancestry most likely lies in another part of the world.

Your genetic profile differs significantly from ancient Sub-Saharan African reference populations. This could indicate genetic similarity to other regions of the world that developed independently from the peoples of Sub-Saharan Africa.

The matches, map, and timeline shown below are still real comparisons against ancient Ancient Sub-Saharan Africa individuals. They represent your closest reference points, even though the genetic distance is large.

You may find a closer fit in the Ancient Iberian Report. Explore other reports
Ancient Sub-Saharan Africa Heritage Index 50/100
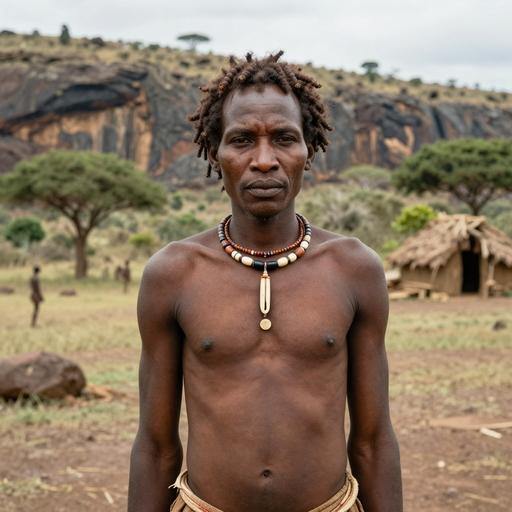
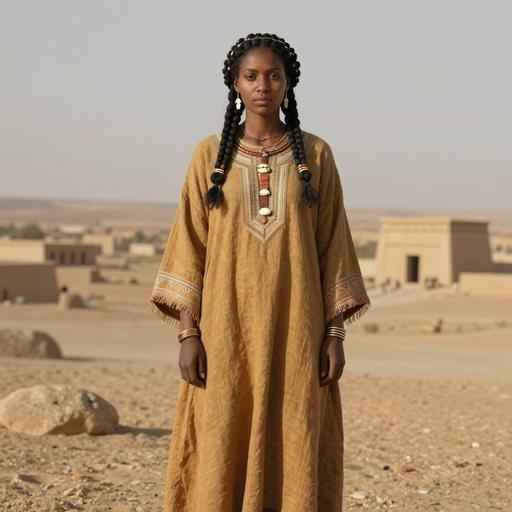
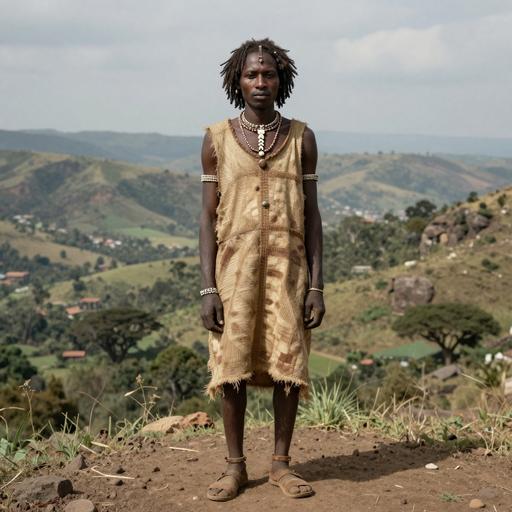
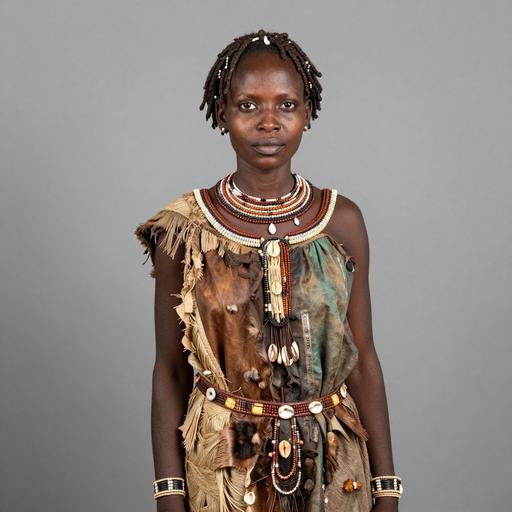
Reconstructed portrait of South Africa Oakhurst Rockshelter Late Holocene individual, Oakhurst Rockshelter (Western Cape, Garden Route District Municipality, George Local Municipality), South Africa (8,584-8,028 BCE)
Closest Match
Stone Age

South Africa Oakhurst Rockshelter Late Holocene individual, South Africa

Sample ID: OAK015

Oakhurst Rockshelter (Western Cape, Garden Route District Municipality, George Local Municipality), South Africa

Your closest genetic match from our Sub-Saharan African reference database. This individual lived approximately 10,610 years ago in what is now South Africa. This comparison shows statistical genetic similarity to reference individuals associated with the Stone Age period; it does not prove direct descent.

8584 BCE - 8028 BCE
Female
Full Profile
How Your 50/100 Similarity Index Was Calculated Full breakdown
Segment Matching 50% weight
100/100

Direct DNA segments shared with ancient individuals, the strongest evidence of connection.

ADMIXTURE Distance 31.25% weight
0/100

How closely your ADMIXTURE composition matches the report's reference samples.
Monte Carlo 18.75% weight
0/100

Statistical goodness-of-fit against this report's reference panel.

Top Connections

Your Closest Sub-Saharan African Reference Individuals

Beyond your #1 match, these ancient Sub-Saharan Africans share the strongest genetic connections with you.

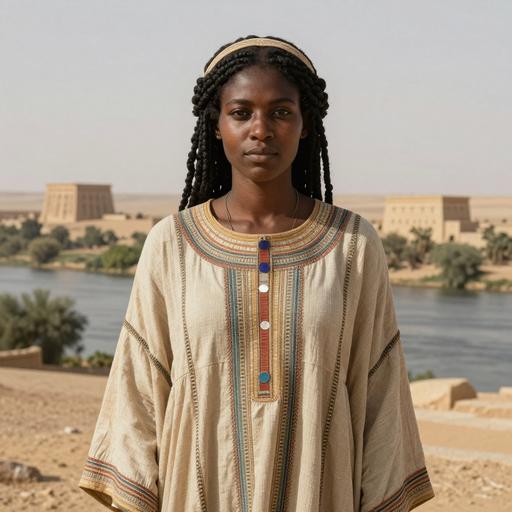
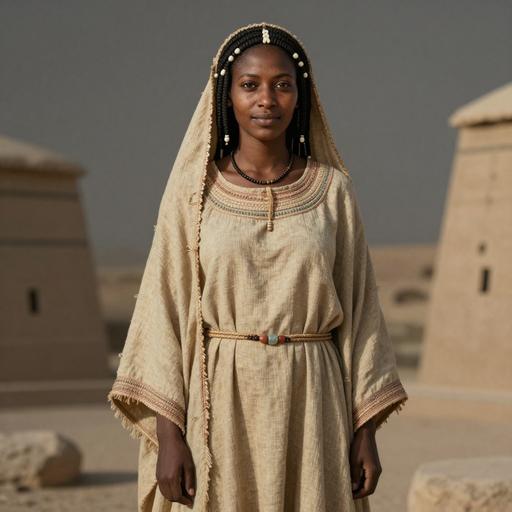
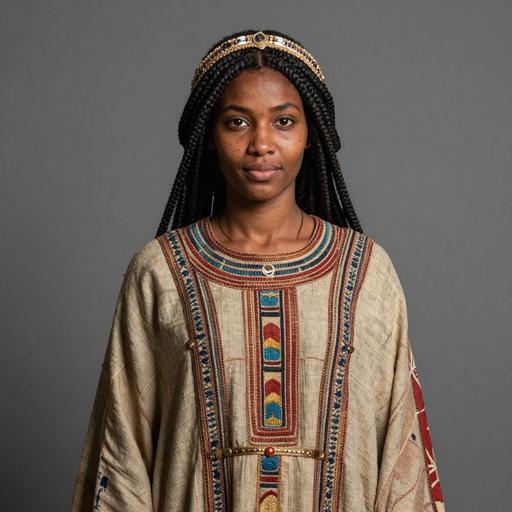
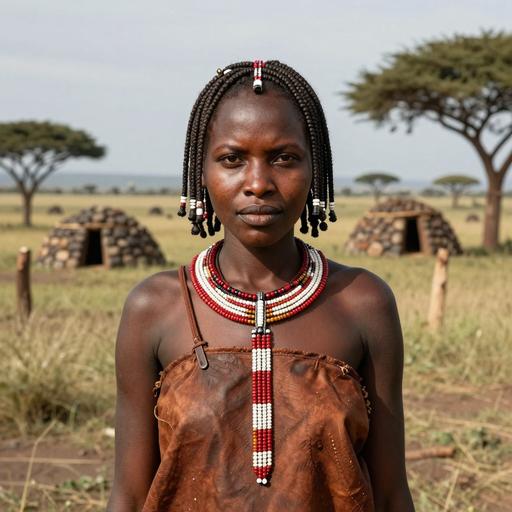
Reconstructed portrait of Medieval Swahili individual, Mtwapa (Kilifi), Kenya (1,323-1,423 CE)
#2 Swahili Culture of Mtwapa

Medieval Swahili individual, Kenya

Sample ID: I19423

Kenya , Mtwapa (Kilifi)

1323 CE ~703 years ago

Quick View
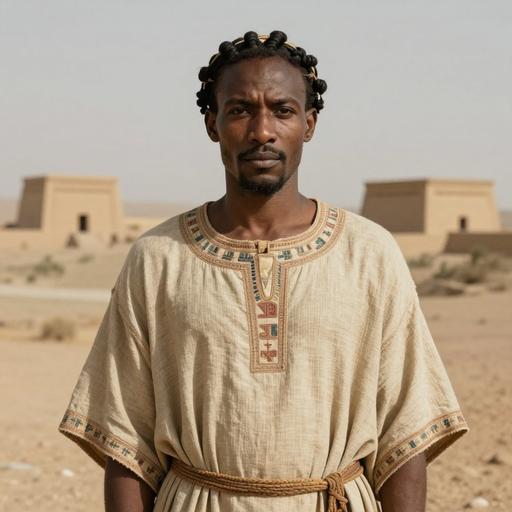
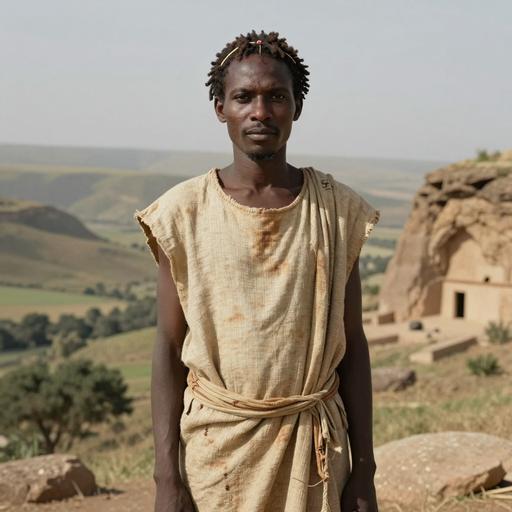
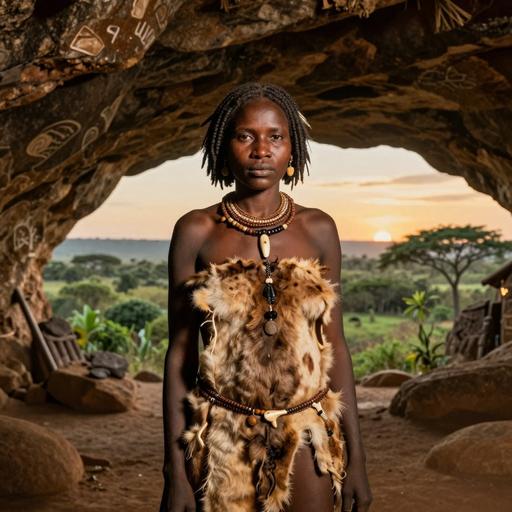
Reconstructed portrait of African Stone Age individual, Gishimangeda Cave, Tanzania (50-60 BCE)
#3 Prehistoric in Tanzania

African Stone Age individual, Tanzania

Sample ID: I13970

Tanzania , Gishimangeda Cave

50 BCE ~2,076 years ago

Quick View
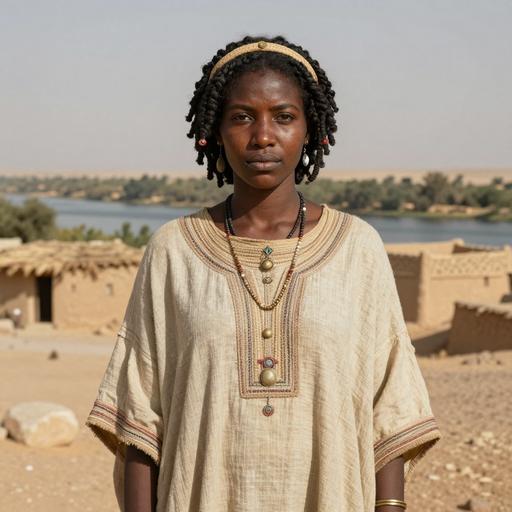
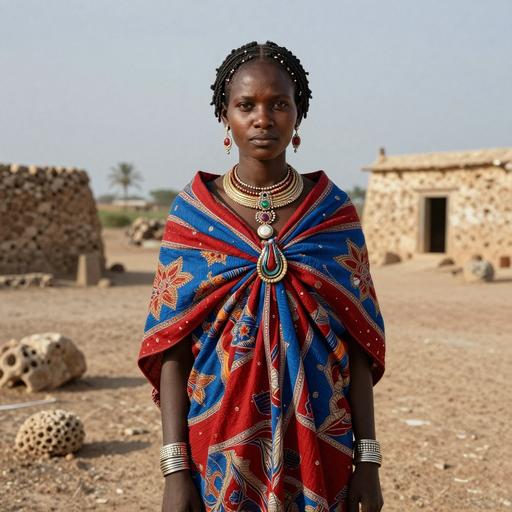
Reconstructed portrait of Swahili individual, Manda (Lamu), Kenya (1,437-1,482 CE)
#4 Swahili Culture of Manda Island

Swahili individual, Kenya

Sample ID: I7938

Kenya , Manda (Lamu)

1437 CE ~589 years ago

Quick View
Reconstructed portrait of Swahili individual, Manda (Lamu), Kenya (800-1,500 CE)
#5 Swahili Culture of Manda Island

Swahili individual, Kenya

Sample ID: I17419

Kenya , Manda (Lamu)

800 CE ~1,226 years ago

Quick View
Geographic Origins

Where Your Ancient Matches Lived

Explore the archaeological sites across Sub-Saharan Africa where your genetic matches were discovered.

4 locations
Legend
Your Matches

Geographic Insight: Your matches span across 2 countries and 3 distinct archaeological sites. Click on any marker to learn more about that ancient individual.
Database

Sample Explorer

Browse the 5 ancient individuals your DNA shows genetic similarity to in this region's Monte Carlo admixture fit. When identity-by-descent (IBD) data is available, the Shared Segments column shows segment evidence. Rows are sorted by strongest segment evidence first (coverage-weighted shared SNPs), then fit-only matches. Click any row for details.

5 matched samples Sorted by strongest segment evidence
Rank Sample Location Era Date Haplogroups Shared Segments
Fit
Reconstructed portrait of African Stone Age individual, Gishimangeda Cave, Tanzania (50-60 BCE)
African Stone Age individual, Tanzania Sample ID: I13970 African Stone Age
Tanzania Gishimangeda Cave Prehistoric in Tanzania 50 BCE ~2,076 yrs ago L3h1a2a1 Fit only
Fit
Reconstructed portrait of Swahili individual, Manda (Lamu), Kenya (800-1,500 CE)
Swahili individual, Kenya Sample ID: I17419 Swahili
Kenya Manda (Lamu) Swahili Culture of Manda Island 800 CE ~1,226 yrs ago L3d1a1a Fit only
Fit
Reconstructed portrait of Medieval Swahili individual, Mtwapa (Kilifi), Kenya (1,323-1,423 CE)
Medieval Swahili individual, Kenya Sample ID: I19423 Swahili
Kenya Mtwapa (Kilifi) Swahili Culture of Mtwapa 1323 CE ~703 yrs ago L0d3 E-M215 Fit only
Fit
Reconstructed portrait of Swahili individual, Manda (Lamu), Kenya (1,437-1,482 CE)
Swahili individual, Kenya Sample ID: I7938 Swahili
Kenya Manda (Lamu) Swahili Culture of Manda Island 1437 CE ~589 yrs ago L2a1b1 Fit only
Fit
Reconstructed portrait of South Africa Oakhurst Rockshelter Late Holocene individual, Oakhurst Rockshelter (Western Cape, Garden Route District Municipality, George Local Municipality), South Africa (8,584-8,028 BCE)
South Africa Oakhurst Rockshelter Late Holocene individual, South Africa Sample ID: OAK015
South Africa Oakhurst Rockshelter (Western Cape, Garden Route District Municipality, George Local Municipality) SOUTHAFRICA OAKHURSTROCKSHELTER LATEHOLOCENE 8584 BCE ~10,610 yrs ago Fit only
Archaeological Cultures

Your Connection to Ancient Sub-Saharan African Cultures

Explore the major archaeological cultures of Sub-Saharan Africa and discover which ones your DNA connects you to most strongly.

Swahili Coast Trading Civilization

800-1500 CE

East African coastal city-states such as Zanzibar and Pemba grew into a cosmopolitan Swahili trading civilization, blending African, Arabian, and Persian genetic and cultural influences through centuries of Indian Ocean maritime trade.

Cultural Match 72.0/100
3 matches

Your score shows strong statistical similarity to reference samples associated with this cultural group.

Culture assignments are based on the archaeological context and era classifications of your matched ancient DNA samples. These connections reflect genetic similarities to populations associated with specific archaeological cultures in Sub-Saharan Africa.

Archaeological Sites

Notable Archaeological Sites

Discover the archaeological sites across Sub-Saharan Africa where your matched ancient DNA samples were discovered.

These archaeological sites represent locations where multiple ancient DNA samples matching your genetic profile were discovered. Each site provides valuable insights into the populations that once inhabited these regions.

Genetic Continuity

Your Ancestral Story

Understanding what your genetic connections reveal about your Sub-Saharan African ancestry.

Your strongest regional connections fall within early foundations.

Strongest
0.0 %

Early Foundations

Stone Age & Pastoral Neolithic

40,000 BCE - 1,500 BCE

This group combines fit-weighted genetic-similarity scores for the relevant cultural periods.

0.0 %

Formative Transformations

Bronze Age & Iron Age & Swahili Coast

1,500 BCE - 1,500 CE

This group combines fit-weighted genetic-similarity scores for the relevant cultural periods.

0.0 %

Historical Connections

Great Kingdoms & Protohistoric & Historic

500 CE - 1,900 CE

This group combines fit-weighted genetic-similarity scores for the relevant cultural periods.

What This Means

Your genetic profile tells a story of continuity and change. While some populations maintained genetic continuity over thousands of years, migrations and cultural exchanges brought new genetic signatures that shaped the modern Sub-Saharan African gene pool. Your results reflect this rich tapestry of population movements and interactions.

Cultural Periods

Your Sub-Saharan African Timeline

Your genetic connections to 8 major periods of Sub-Saharan African history, from prehistoric to medieval.

Your Sub-Saharan African Ancient Matches Through Time

40,000 BCE — 1,900 CE | 5 ancient connections across 41+ millennia

Stone Age 0.0/100
Pastoral Neolithic 0.0/100
Bronze Age 0.0/100
Iron Age 0.0/100
Swahili Coast 0.0/100
Great Kingdoms 0.0/100
Protohistoric 0.0/100
Historic 0.0/100
40,000 BCE
29,525 BCE
19,050 BCE
8,575 BCE
1,900 CE
Reconstructed portrait of South Africa Oakhurst Rockshelter Late Holocene individual, Oakhurst Rockshelter (Western Cape, Garden Route District Municipality, George Local Municipality), South Africa (8,584-8,028 BCE)
South Africa Oakhu...
South Africa Oakhurst Rockshelter Late Holocene individual, South Africa 8584 BCE
Reconstructed portrait of South Africa Oakhurst Rockshelter Late Holocene individual, Oakhurst Rockshelter (Western Cape, Garden Route District Municipality, George Local Municipality), South Africa (8,584-8,028 BCE)
South Africa Oakhurst Rockshelter Late Holocene individual, South Africa 8584 BCE
Reconstructed portrait of African Stone Age individual, Gishimangeda Cave, Tanzania (50-60 BCE)
African Stone Age ...
African Stone Age individual, Tanzania 50 BCE Prehistoric in Tanzania
Reconstructed portrait of African Stone Age individual, Gishimangeda Cave, Tanzania (50-60 BCE)
African Stone Age individual, Tanzania 50 BCE Prehistoric in Tanzania
Reconstructed portrait of Swahili individual, Manda (Lamu), Kenya (800-1,500 CE)
Swahili individual...
Swahili individual, Kenya 800 CE Swahili Culture of Manda Island
Reconstructed portrait of Swahili individual, Manda (Lamu), Kenya (800-1,500 CE)
Swahili individual, Kenya 800 CE Swahili Culture of Manda Island
Reconstructed portrait of Medieval Swahili individual, Mtwapa (Kilifi), Kenya (1,323-1,423 CE)
Medieval Swahili i...
Medieval Swahili individual, Kenya 1323 CE Swahili Culture of Mtwapa
Reconstructed portrait of Medieval Swahili individual, Mtwapa (Kilifi), Kenya (1,323-1,423 CE)
Medieval Swahili individual, Kenya 1323 CE Swahili Culture of Mtwapa
Reconstructed portrait of Swahili individual, Manda (Lamu), Kenya (1,437-1,482 CE)
Swahili individual...
Swahili individual, Kenya 1437 CE Swahili Culture of Manda Island
Reconstructed portrait of Swahili individual, Manda (Lamu), Kenya (1,437-1,482 CE)
Swahili individual, Kenya 1437 CE Swahili Culture of Manda Island
Stone Age 0.0/100 affinity
Pastoral Neolithic 0.0/100 affinity
Bronze Age 0.0/100 affinity
Iron Age 0.0/100 affinity
Swahili Coast 0.0/100 affinity
Great Kingdoms 0.0/100 affinity
Protohistoric 0.0/100 affinity
Historic 0.0/100 affinity
Through the Ages

Your Sub-Saharan African Journey Through Time

Each era below represents a chapter of sub-saharan african history

2 connections

Swahili Culture of Manda Island

Swahili Coast

Region & Environment

Manda Island lies along the Kenya coast within an environment shaped by the Western Indian Ocean—its marine resources, sheltered coastal zones, and navigation routes. Coastal conditions supported both fishing and trade-related provisioning, while nearby hinterlands offered opportunities for cultivation and resource access.

2 Samples
1 Country
~1,226 Years Ago
800 CE - 1,500 CE Period
Genetic Signatures
L2a1b1 1 L3d1a1a 1
Regions Represented
Kenya (2)
1 connection

SouthAfrica OakhurstRockshelter LateHolocene

Stone Age

Region & Environment

Oakhurst Rock Shelter lies within South Africa’s varied landscapes where Late Holocene environmental conditions could differ markedly over short distances. Rock-shelter contexts typically indicate repeated use of sheltered spots that offered protection from weather and supported day-to-day work such as tool maintenance and food processing. As climates and local resource distributions changed, people could adjust the timing and intensity of shelter use.

1 Sample
1 Country
~10,610 Years Ago
3,000 BCE - 500 BCE Period
Regions Represented
South Africa (1)
1 connection

Swahili Culture of Mtwapa

Swahili Coast

Region & Environment

Mtwapa lies on Kenya’s coast within the broader Swahili littoral of East Africa. The region combines mangrove and coastal wetlands with sandy shorelines and fertile riverine strips, creating varied habitats for fishing, farming near water sources, and easy access to maritime routes.

1 Sample
1 Country
~703 Years Ago
1,000 CE - 1,500 CE Period
Genetic Signatures
E-M215 1 L0d3 1
Regions Represented
Kenya (1)
1 connection

Prehistoric in Tanzania

Pastoral Neolithic

Overview

This entry provides a very wide prehistoric bracket for Tanzania labeled by MajorCategory and era as an “Africa East Pastoralist” context. Within such a broad timeframe (100,000–1000 BCE), the archaeological emphasis is on stone-based technologies and shifting patterns of movement, subsistence, and site use.

1 Sample
1 Country
~2,076 Years Ago
100,000 BCE - 1,000 BCE Period
Genetic Signatures
L3h1a2a1 1
Regions Represented
Tanzania (1)

"Sub-Saharan Africa contains the deepest and most diverse population histories represented in the human story."

— Ancient Sub-Saharan Africa
Era Analysis

Your Era Profile

A visual snapshot of fit-weighted genetic similarity to reference samples from different periods of Sub-Saharan Africa. The further the point from the center, the higher the affinity score within this report.

Era Distribution Unavailable Unable to calculate era distribution 4 matched sample(s) found, but era scores could not be calculated
Understanding Your Era Profile

Your dominant connection to the Stone Age suggests that a significant portion of your Sub-Saharan African ancestry traces back to populations who lived during this transformative period of Sub-Saharan African history. This doesn't mean your ancient matches were exclusively from this era, rather, it indicates where the strongest genetic signals appear in your connection to ancient Sub-Saharan African populations.

Genetic Analysis

Your Position in Sub-Saharan African Genetic Space

Explore a reference-fixed ADMIXTURE projection. The reference map stays identical for every kit using the same report version.

PCA reduces the N-dimensional ADMIXTURE reference panel to selected axes in a shared, reference-fixed ADMIXTURE PCA space. The chart currently shows the selected components. Variance percentages are global to that shared model and are not re-fit per report. Distance and filtering use the original N-dimensional ADMIXTURE values. Your kit is the gold diamond. This is not a Global25/Vahaduo plot.

Closest references in full ADMIXTURE space

This table is the non-visual equivalent of the chart and uses full-dimensional distance rather than apparent 2D spacing.

ReferencePeriodPlace/dateDistance

Composite Score Breakdown

Your Ancient Sub-Saharan Africa Similarity Index (50/100) is calculated from three weighted components, with segment-level matches carrying the most weight because they are the strongest genetic evidence:

Segment Matching 50%
100/100

Direct DNA segments (identity-by-descent) shared with ancient Sub-Saharan African individuals, the strongest evidence of a genetic connection.

ADMIXTURE Distance 31.25%
0/100

Euclidean genetic distance between your ADMIXTURE composition and Sub-Saharan African reference samples.

Monte Carlo 18.75%
0/100

Goodness-of-fit for stochastic modeling against the Sub-Saharan African reference panel.

Shared DNA Segments

You share DNA segments with 62 ancient Sub-Saharan African individuals, totalling 1,018.9 cM across 98 segments. These shared segments are the strongest evidence in your Ancient Sub-Saharan Africa Similarity Index. Segment length is most reliable when backed by dense SNP coverage; matches flagged Low coverage below come from ancient samples with sparse genotyping, so their shared-cM value is less certain even when it looks large.

Reconstructed portrait of Pastoral N individual, Gishimangeda Cave, Tanzania (776-487 BCE) 15.3 cM
Pastoral N individual, Tanzania

Sample ID: I13980

Tanzania 4 segments · 55.5 SNPs/cM
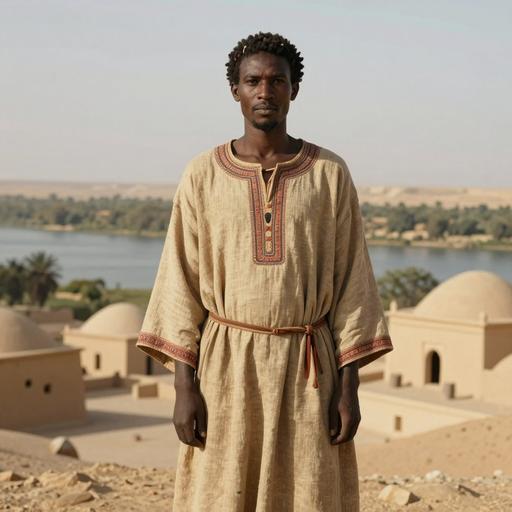
Reconstructed portrait of Kulubnarti21 S46 Kulubnarti S Christian individual, Nubia. Kulubnarti. Cemetery S, Sudan (773-978 CE) 13.2 cM
Kulubnarti21 S46 Kulubnarti S Christian individual, Sudan

Sample ID: I6336

Sudan 3 segments · 51.7 SNPs/cM
Reconstructed portrait of Kulubnarti21 S46 Kulubnarti S Christian individual, Nubia. Kulubnarti. Cemetery S, Sudan (710-886 CE) 12.7 cM
Kulubnarti21 S46 Kulubnarti S Christian individual, Sudan

Sample ID: I6324

Sudan 3 segments · 51.7 SNPs/cM
Reconstructed portrait of Nubian Civilization individual, Nubia. Kulubnarti. Cemetery S, Sudan (650-1,050 CE) 13.6 cM
Nubian Civilization individual, Sudan

Sample ID: I18519

Sudan 3 segments · 48.2 SNPs/cM
Reconstructed portrait of Kulubnarti21 S46 Kulubnarti S Christian individual, Nubia. Kulubnarti. Cemetery S, Sudan (669-820 CE) 20.4 cM
Kulubnarti21 S46 Kulubnarti S Christian individual, Sudan

Sample ID: I6325

Sudan 3 segments · 38.2 SNPs/cM
Reconstructed portrait of Kulubnarti21 S46 Kulubnarti S Christian individual, Nubia. Kulubnarti. Cemetery S, Sudan (773-887 CE) 33.1 cM
Kulubnarti21 S46 Kulubnarti S Christian individual, Sudan

Sample ID: I6256

Sudan 4 segments · 29.2 SNPs/cM
Reconstructed portrait of Sub-Saharan African individual, Mzimba District. Hora, Malawi (7,131-6,775 BCE) 15.4 cM
Sub-Saharan African individual, Malawi

Sample ID: I2966

Malawi 3 segments · 41.1 SNPs/cM
Reconstructed portrait of Pastoral N individual, Nakuru. Naivasha Burial Groud, Kenya (541-402 BCE) 9.4 cM
Pastoral N individual, Kenya

Sample ID: I8814

Kenya 2 segments · 52.1 SNPs/cM
Reconstructed portrait of LSA individual, Victoria Nyanza. Kisumu. Jawuoyo Rockshelter, Kenya (84-211 BCE) 9.2 cM
LSA individual, Kenya

Sample ID: I8808

Kenya 2 segments · 50.9 SNPs/cM
Reconstructed portrait of Kulubnarti21 S46 Kulubnarti S Christian individual, Nubia. Kulubnarti. Cemetery S, Sudan (656-775 CE) 10.8 cM
Kulubnarti21 S46 Kulubnarti S Christian individual, Sudan

Sample ID: I6338

Sudan 2 segments · 41.7 SNPs/cM
Reconstructed portrait of Kulubnarti21 S46 Kulubnarti S Christian individual, Nubia. Kulubnarti. Cemetery S, Sudan (676-773 CE) 12.3 cM
Kulubnarti21 S46 Kulubnarti S Christian individual, Sudan

Sample ID: I6326

Sudan 2 segments · 39.0 SNPs/cM
Reconstructed portrait of Kulubnarti S Christian individual, Nubia. Kulubnarti. Cemetery S, Sudan (650-950 CE) 29.9 cM
Kulubnarti S Christian individual, Sudan

Sample ID: I18509

Sudan 3 segments · 24.7 SNPs/cM
Low coverage
Haplogroup Evolution

Haplogroup Distribution Across Sub-Saharan African History

Explore how Y-DNA and mtDNA haplogroups changed across different periods of Sub-Saharan African history.

0
Total Samples
0
Cultural Periods
0
Unique Haplogroups

Bronze Age

3 samples
E-BY75850 1
50.0%
Reconstructed portrait of Ancient Cushitic individual, Gamo Highlands. Mota Cave, Ethiopia (2,576-2,465 BCE) Ancient Cushitic individual, Ethiopia Sample ID: I5950 Gamo Highlands. Mota Cave
Ethiopia
E-Y175024 1
50.0%
Reconstructed portrait of Ancient Cushitic individual, Mota Cave (Southwest Ethiopia, Gamo Highlands), Ethiopia (2,576-2,465 BCE) Ancient Cushitic individual, Ethiopia Sample ID: mota Mota Cave (Southwest Ethiopia, Gamo Highlands)
Ethiopia

Bronze Age

3 samples
L2a1 1
33.3%
Reconstructed portrait of Bantu individual, Luxmanda. UVS40, Tanzania (1,204-937 BCE) Bantu individual, Tanzania Sample ID: I3726 Luxmanda. UVS40
Tanzania
L3x2a2b* 1
33.3%
Reconstructed portrait of Ancient Cushitic individual, Gamo Highlands. Mota Cave, Ethiopia (2,576-2,465 BCE) Ancient Cushitic individual, Ethiopia Sample ID: I5950 Gamo Highlands. Mota Cave
Ethiopia
L3x2a 1
33.3%
Reconstructed portrait of Ancient Cushitic individual, Mota Cave (Southwest Ethiopia, Gamo Highlands), Ethiopia (2,576-2,465 BCE) Ancient Cushitic individual, Ethiopia Sample ID: mota Mota Cave (Southwest Ethiopia, Gamo Highlands)
Ethiopia

These distributions show the frequency of Y-DNA and mtDNA haplogroups among all ancient Sub-Saharan African samples from each cultural period. Haplogroup frequencies changed over time due to migrations, population movements, and genetic drift.

AI Analysis

Your Personal Guide

Understanding ancient DNA results can be complex. Our AI assistant helps you make sense of your connections, explaining what your results mean and placing them in historical context.

AI ASSISTANT by DNAGENICS

Enabled until 2027-09-15

This AI analysis is limited to your Ancient Sub-Saharan Africa genetic-similarity results. AI output is inferential and is not proof of ancestry or direct descent.

Try these questions:

Learn More

Understanding Your Results

This report uses a three-component genetic-similarity scoring system:

  • Segment Matching (50%): coverage-aware IBD evidence shared with reference individuals.
  • ADMIXTURE Distance (31.25%): Euclidean distance in the original 15-dimensional ADMIXTURE space.
  • Monte Carlo Fit (18.75%): goodness-of-fit against this report's selected reference panel.

The PCA is fitted once from reference samples only. Your kit is projected afterward, so it cannot move the map. The selected two axes omit some variation; use the full-space distance table for nearest-reference comparisons.

What does the Ancient Sub-Saharan Africa Heritage Index mean?

The Ancient Sub-Saharan Africa Heritage Index (0-100) represents your overall genetic similarity to ancient Sub-Saharan African populations. Higher scores indicate closer genetic proximity.

Why don't my cultural-period scores add up to 100?

They are fit-weighted affinity scores, not ancestry percentages. Each conditional period share is multiplied by the overall Monte Carlo fit, so the period scores add up to that model-fit score.

Can I compare this chart with Global25 or another regional report?

No. This is a fixed ADMIXTURE projection for this report's reference panel. You can compare kits within the same report and projection version, but not coordinates across regions or with Vahaduo/Global25.

What counts as a matched sample in Sample Explorer?

A matched sample is a reference individual included in your regional Monte Carlo admixture fit (statistical genetic similarity to this report's panel). When identity-by-descent data is available, Shared Segments shows segment evidence. The table is sorted by strongest segment evidence first (coverage-weighted shared SNPs); fit-only matches without segment data follow afterward.

Exploring Demo Data This is a live preview using sample data. Unlock your full report with your own results.
Demo Mode
Use code for 35% off Expires Sep 16