Ancient Southeast Asia & Oceania Ancestry Report

Download PDF creates a visual, rasterized copy. Use Print for selectable text and better assistive-technology support.

Ancient Southeast Asia & Oceania Heritage

Analyzing your genetic similarity to ancient Southeast Asian and Oceanian populations...

Preparing your genetic-similarity report

Skip to main content
Ancient Southeast Asia & Oceania DNA Analysis

Your Ancient Southeast Asia & Oceania Heritage

(SSUAJF) Demo Report

Your Closest Matches Are Genetically Distant

We compared your DNA to every sample in our Ancient Southeast Asia & Oceania reference panel and ranked the closest ones for you below. Your nearest matches are quite distant, which suggests your primary ancestry most likely lies in another part of the world.

Your DNA shows significant genetic similarity to Northern European reference populations but minimal similarity to Southeast Asian or Oceanian reference populations. You may find more relevant results in our British Isles or Celtic reports.

The matches, map, and timeline shown below are still real comparisons against ancient Ancient Southeast Asia & Oceania individuals. They represent your closest reference points, even though the genetic distance is large.

You may find a closer fit in the Ancient East Asia Report. Explore other reports
Ancient Southeast Asia & Oceania Heritage Index 52/100
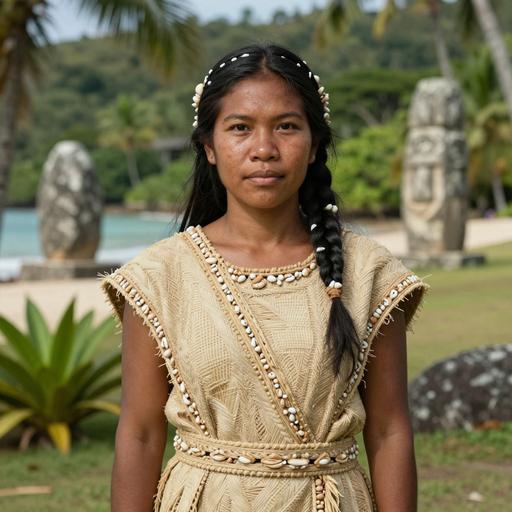
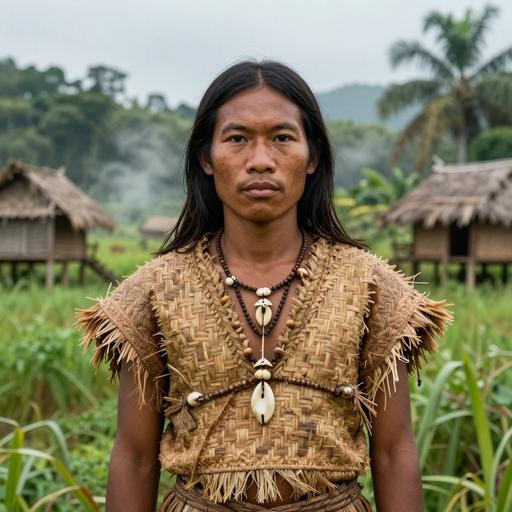
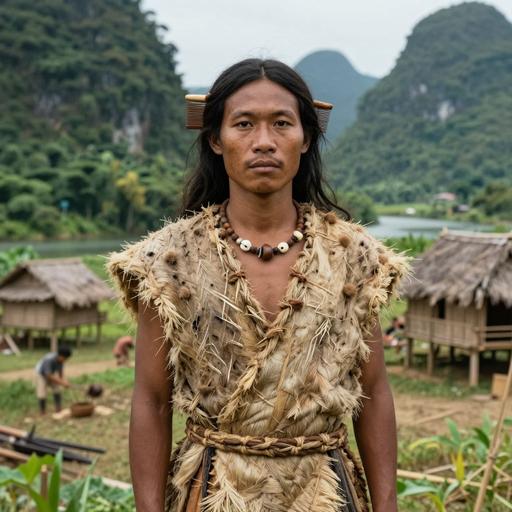
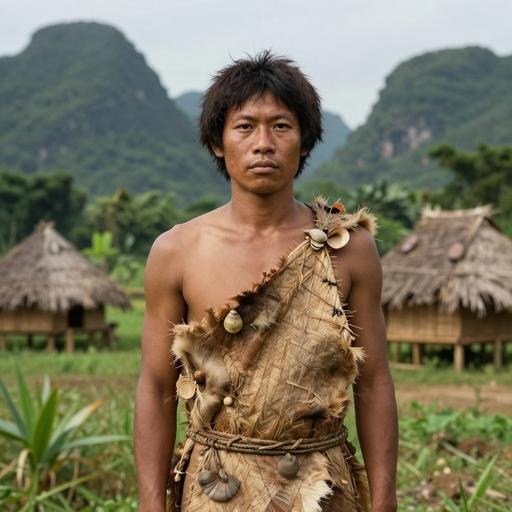
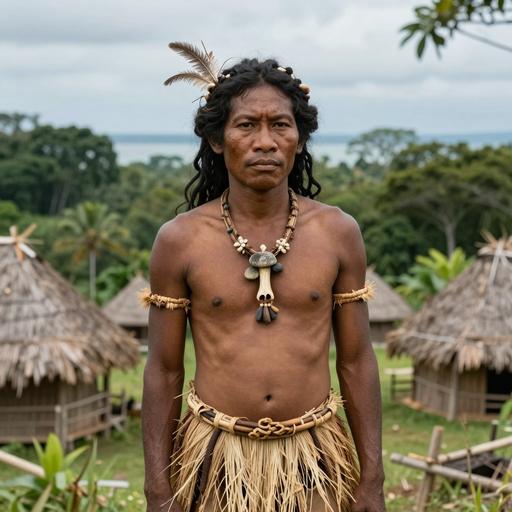
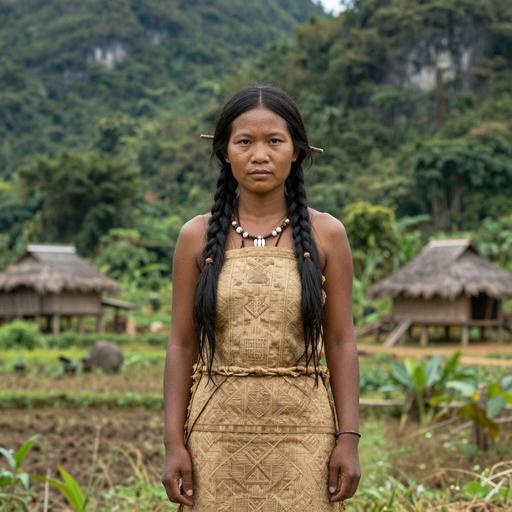
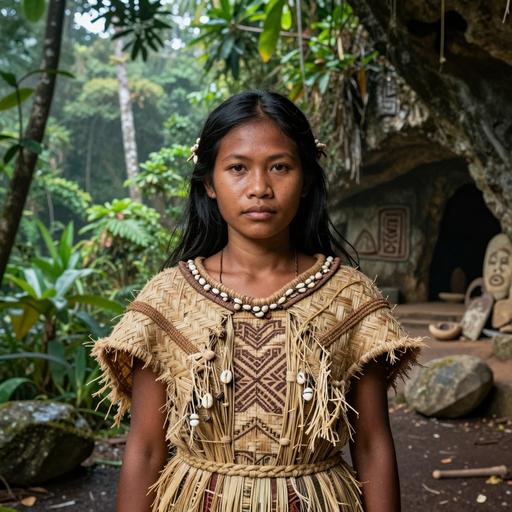
Reconstructed portrait of Koror Quarry individual, Koror Quarry (Koror Island), Palau (226-574 CE)
Closest Match
Pacific

Koror Quarry individual, Palau

Sample ID: I43046

Koror Quarry (Koror Island), Palau

Your closest genetic match from our Southeast Asian and Oceanian reference database. This individual lived approximately 1,800 years ago in what is now Palau. This comparison shows statistical genetic similarity to reference individuals associated with the Pacific period; it does not prove direct descent.

226 CE - 574 CE
Female
Full Profile
How Your 52/100 Similarity Index Was Calculated Full breakdown
Segment Matching 50% weight
100/100

Direct DNA segments shared with ancient individuals, the strongest evidence of connection.

ADMIXTURE Distance 31.25% weight
2/100

How closely your ADMIXTURE composition matches the report's reference samples.

Monte Carlo 18.75% weight
7/100

Statistical goodness-of-fit against this report's reference panel.

Top Connections

Your Closest Southeast Asian and Oceanian Reference Individuals

Beyond your #1 match, these ancient Southeast Asian and Oceanian peoples share the strongest genetic connections with you.

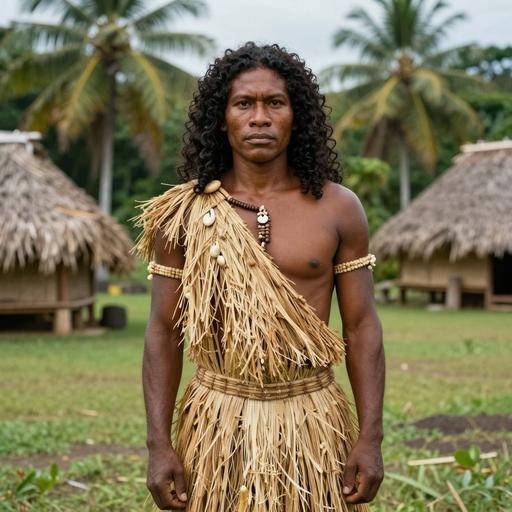
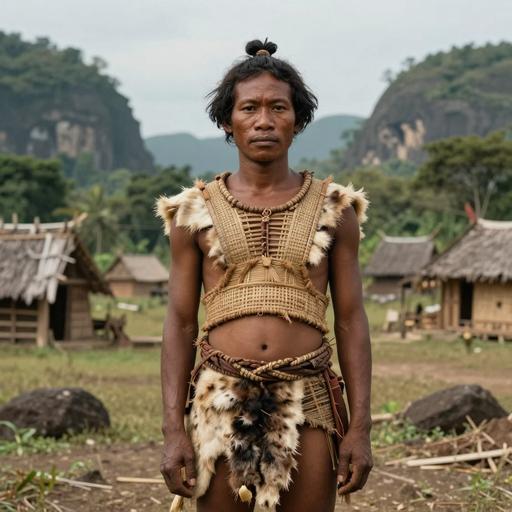
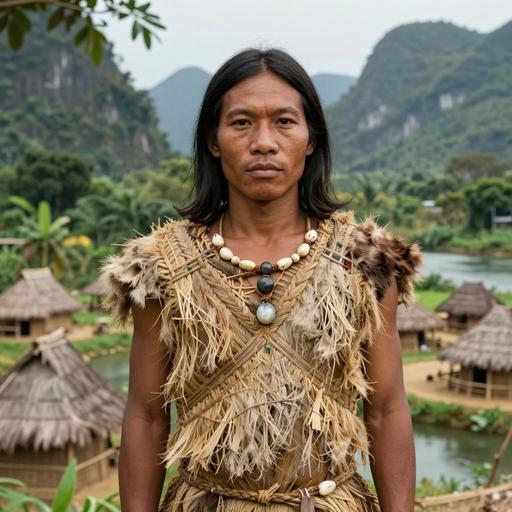
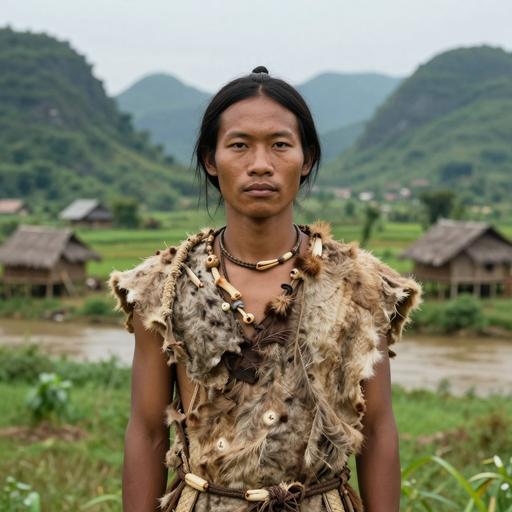
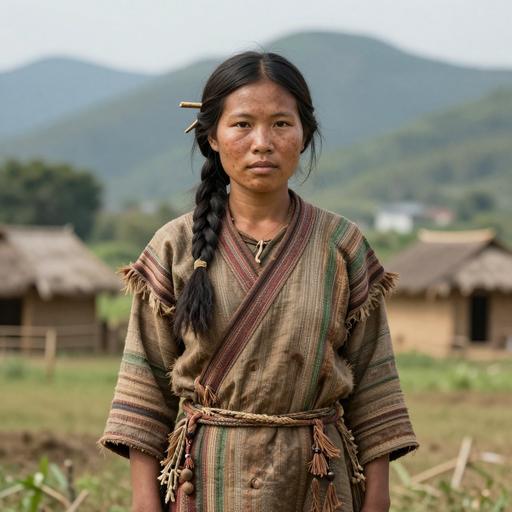
Reconstructed portrait of Hoabinhian individual, Northern Bolikhamsay. Pha Faen, Laos (6,012-5,837 BCE)
#2 The Hoabinhian Culture

Hoabinhian individual, Laos

Sample ID: La368

Laos , Northern Bolikhamsay. Pha Faen

6012 BCE ~8,038 years ago

Quick View
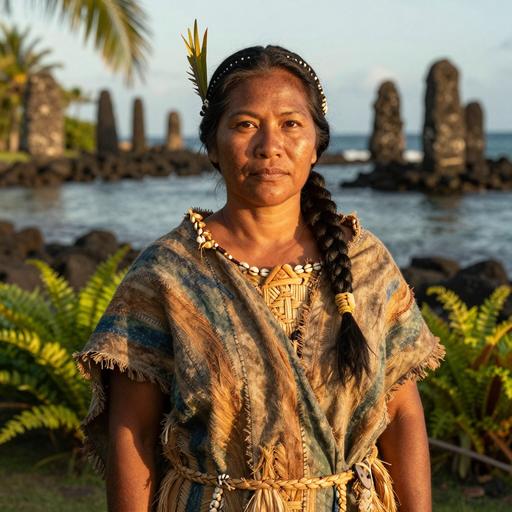
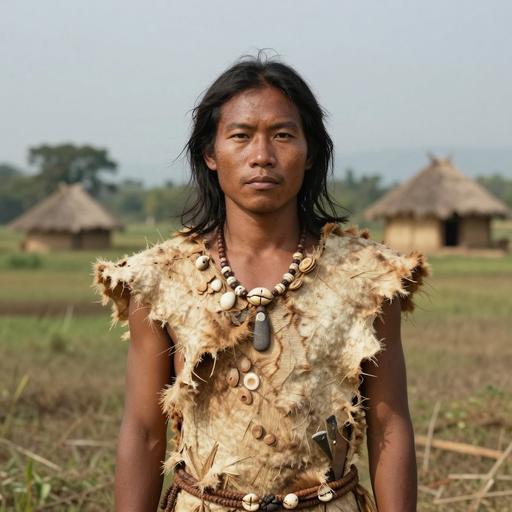
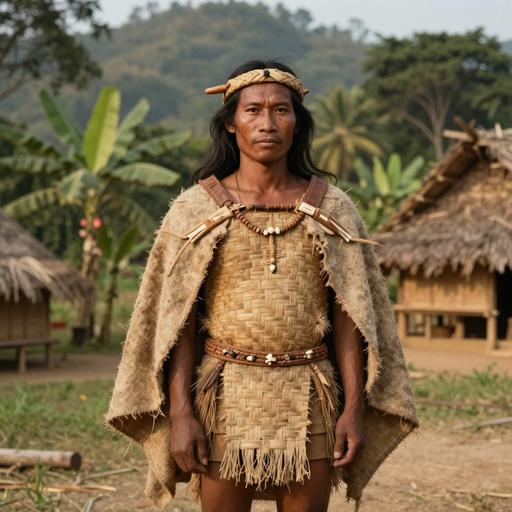
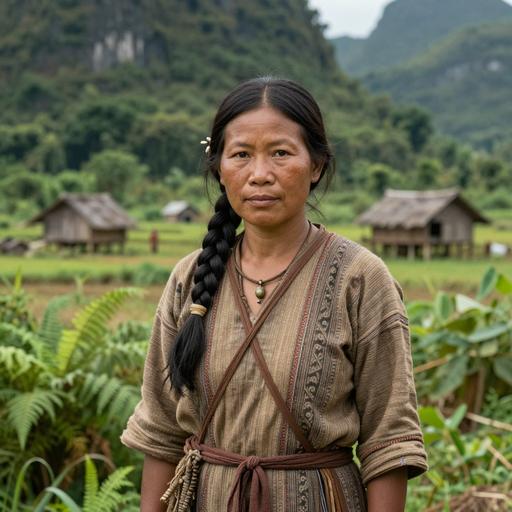
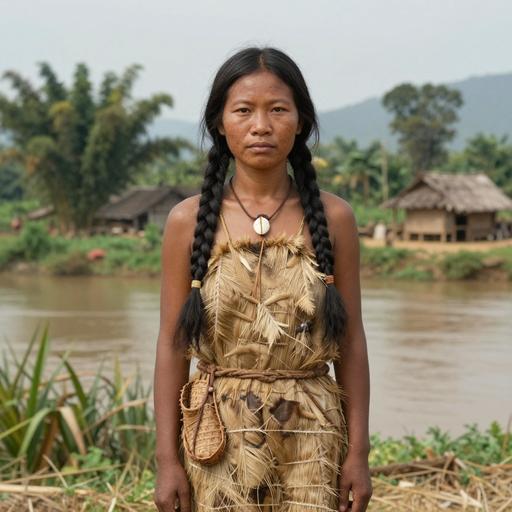
Reconstructed portrait of BA individual, Ban Chiang, Thailand (1,200-1,000 BCE)
#3 Bronze Age Thailand

BA individual, Thailand

Sample ID: I8977

Thailand , Ban Chiang

1200 BCE ~3,226 years ago

Quick View
Geographic Origins

Where Your Ancient Matches Lived

Explore the archaeological sites across Southeast Asia and Oceania where your genetic matches were discovered.

3 locations
Legend
Your Matches

Geographic Insight: Your matches span across 3 countries and 3 distinct archaeological sites. Click on any marker to learn more about that ancient individual.

Database

Sample Explorer

Browse the 3 ancient individuals your DNA shows genetic similarity to in this region's Monte Carlo admixture fit. When identity-by-descent (IBD) data is available, the Shared Segments column shows segment evidence. Rows are sorted by strongest segment evidence first (coverage-weighted shared SNPs), then fit-only matches. Click any row for details.

3 matched samples Sorted by strongest segment evidence
Rank Sample Location Era Date Haplogroups Shared Segments
#1
Reconstructed portrait of Hoabinhian individual, Northern Bolikhamsay. Pha Faen, Laos (6,012-5,837 BCE)
Hoabinhian individual, Laos Sample ID: La368 Austroasiatic
Laos Northern Bolikhamsay. Pha Faen The Hoabinhian Culture 6012 BCE ~8,038 yrs ago M5 C-K150 1 seg · 4.2 cM
Fit
Reconstructed portrait of Koror Quarry individual, Koror Quarry (Koror Island), Palau (226-574 CE)
Koror Quarry individual, Palau Sample ID: I43046
Palau Koror Quarry (Koror Island) PALAU KORORQUARRY 1500BP 226 CE ~1,800 yrs ago Fit only
Fit
Reconstructed portrait of BA individual, Ban Chiang, Thailand (1,200-1,000 BCE)
BA individual, Thailand Sample ID: I8977 Southeast Asian Civilizations
Thailand Ban Chiang Bronze Age Thailand 1200 BCE ~3,226 yrs ago B5a1c NO-M214 Fit only
Archaeological Cultures

Your Connection to Ancient Southeast Asian and Oceanian Cultures

Explore the major archaeological cultures of Southeast Asia and Oceania and discover which ones your DNA connects you to most strongly.

Hoabinhian Culture

~44,000-2,000 BCE

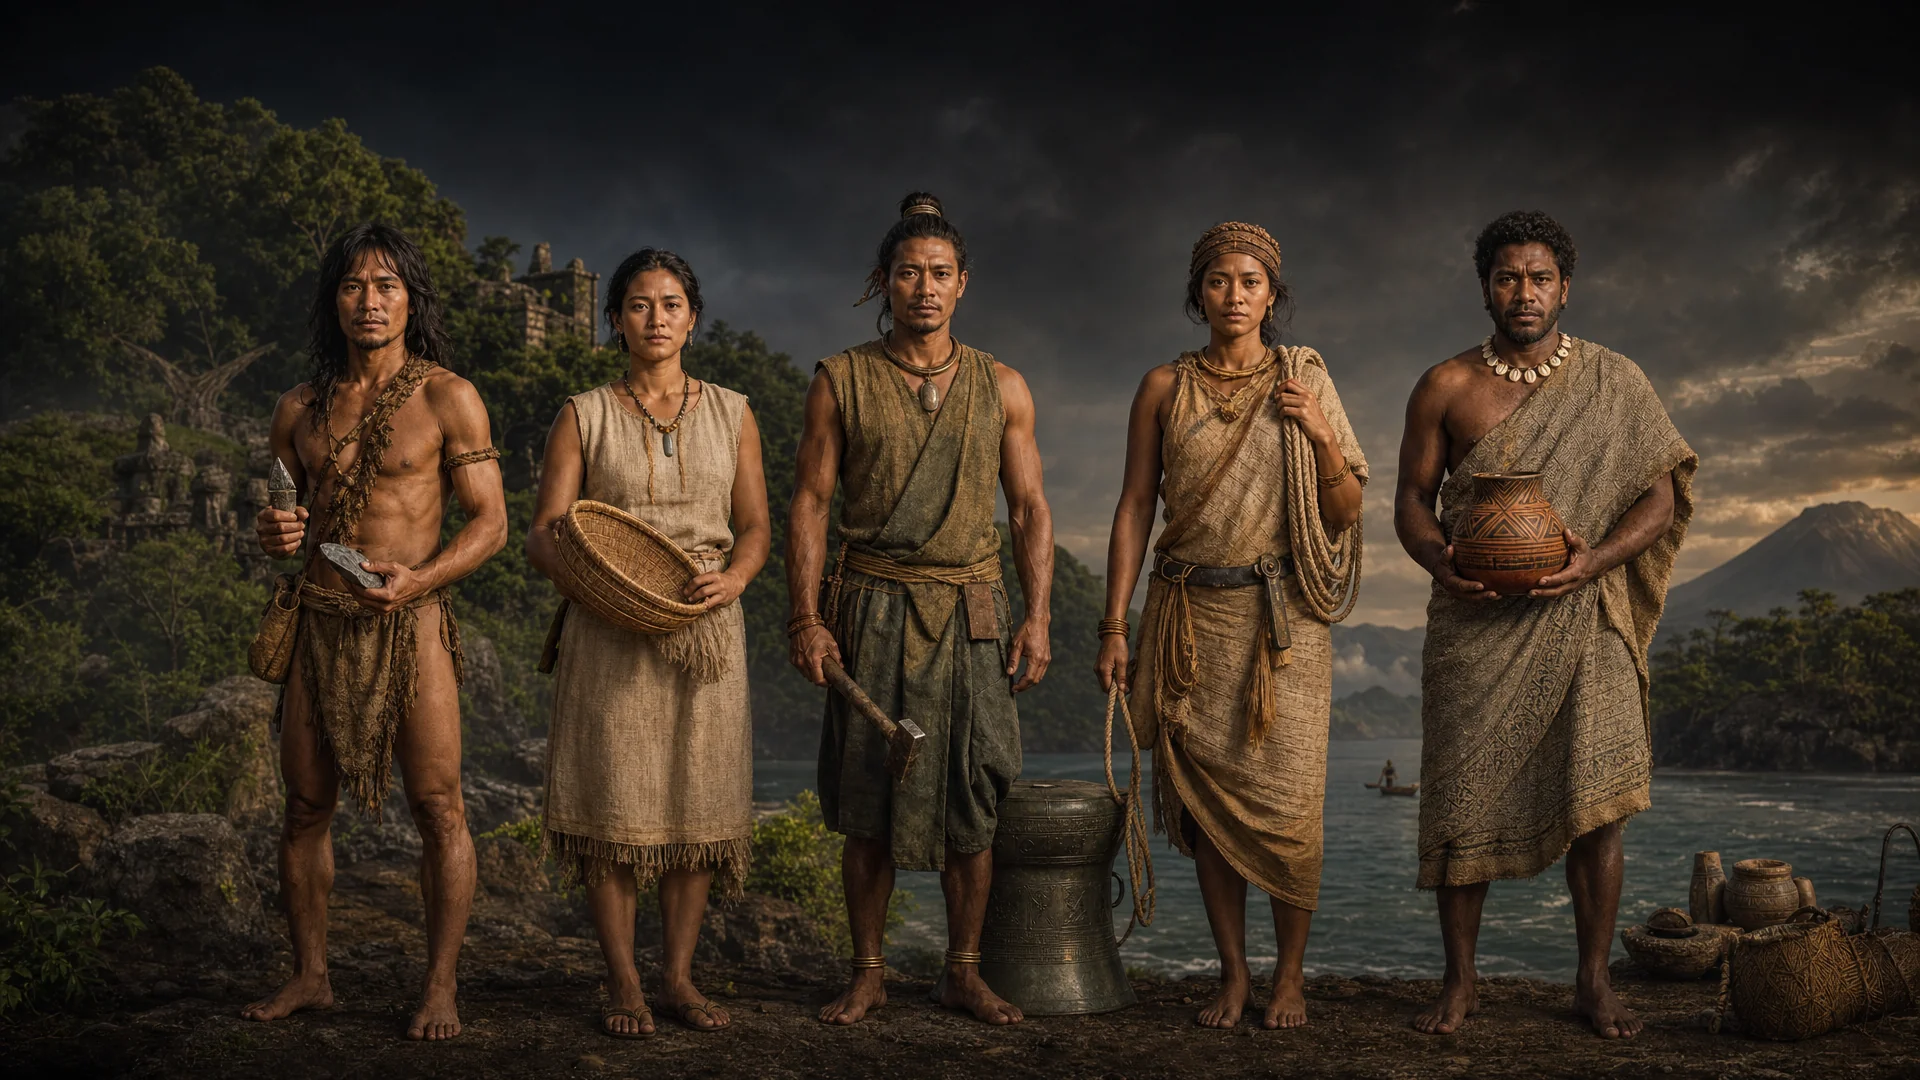
The Hoabinhian technocomplex describes a long-lived hunter-gatherer stone tool tradition found across mainland and island Southeast Asia, represented by cave sites such as Spirit Cave in Thailand and Niah Cave in Borneo. Reference samples from these sites show genetic similarity to early Southeast Asian hunter-gatherer populations that predate later farming expansions.
Cultural Match 30.0/100
1 match

Your score shows moderate statistical similarity to reference samples associated with this culture.

Culture assignments are based on the archaeological context and era classifications of your matched ancient DNA samples. These connections reflect genetic similarities to populations associated with specific archaeological cultures in Southeast Asia and Oceania.

Regional Heritage

Your Southeast Asian and Oceanian Regional Connections

Discover which modern regions of Southeast Asia and Oceania show the strongest genetic connections to your ancestry.

#1
Strongest Regional Connection

Thailand, Thailand

32.5/100

Mainland Southeast Asia, spanning the Hoabinhian hunter-gatherer sites, the Bronze Age metallurgy center of Ban Chiang, and later Dvaravati, Sukhothai, and Ayutthaya kingdoms.

1 ancient match
#1

Thailand

Thailand
Regional Match 32.5/100

Regional assignments are based on the geographic locations where your matched ancient DNA samples were discovered. These connections reflect genetic similarities to populations from specific regions of Southeast Asia and Oceania. Click on any region card to explore the samples from that area.

Archaeological Sites

Notable Archaeological Sites

Discover the archaeological sites across Southeast Asia and Oceania where your matched ancient DNA samples were discovered.

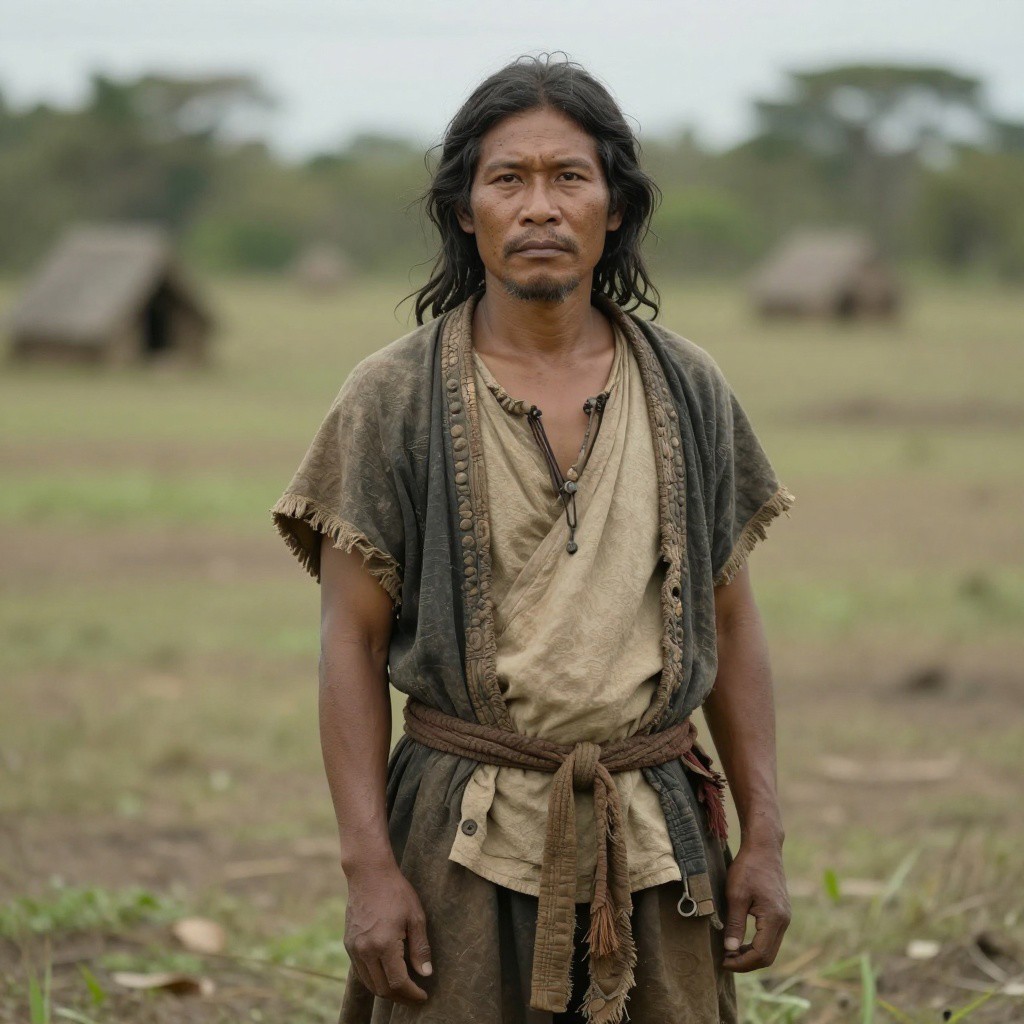
These archaeological sites represent locations where multiple ancient DNA samples matching your genetic profile were discovered. Each site provides valuable insights into the populations that once inhabited these regions.
Genetic Continuity

Your Ancestral Story

Understanding what your genetic connections reveal about your Southeast Asian and Oceanian ancestry.

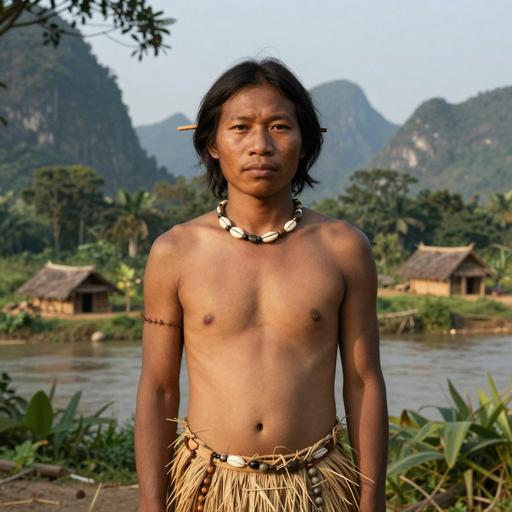
Your strongest regional connections fall within historical connections.
0.5 %

Early Foundations

Paleolithic & Neolithic

50,000 BCE - 2,000 BCE

This group combines fit-weighted genetic-similarity scores for the relevant cultural periods.

0.4 %

Formative Transformations

Bronze Age & Iron Age & Classical

2,000 BCE - 900 CE

This group combines fit-weighted genetic-similarity scores for the relevant cultural periods.

Strongest
5.9 %

Historical Connections

Maritime & Pacific

2,000 BCE - 1,500 CE

This group combines fit-weighted genetic-similarity scores for the relevant cultural periods.

What This Means

Your genetic profile tells a story of continuity and change. While some populations maintained genetic continuity over thousands of years, migrations and cultural exchanges brought new genetic signatures that shaped the modern Southeast Asian and Oceanian gene pool. Your results reflect this rich tapestry of population movements and interactions.
Cultural Periods

Your Southeast Asian and Oceanian Timeline

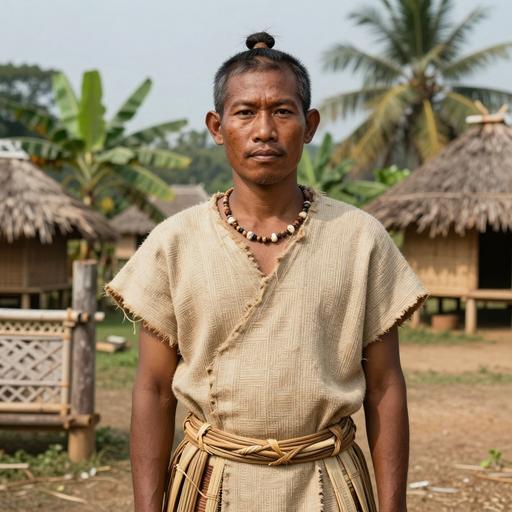
Your genetic connections to 7 major periods of Southeast Asian and Oceanian history, from prehistoric to medieval.

Your Southeast Asian and Oceanian Ancient Matches Through Time

50,000 BCE — 1,500 CE | 3 ancient connections across 51+ millennia

Paleolithic 0.5/100
Neolithic 0.0/100
Bronze Age 0.4/100
Iron Age 0.0/100
Classical 0.0/100
Maritime 0.0/100
Pacific 5.9/100
50,000 BCE
37,125 BCE
24,250 BCE
11,375 BCE
1,500 CE
Reconstructed portrait of Hoabinhian individual, Northern Bolikhamsay. Pha Faen, Laos (6,012-5,837 BCE)
Hoabinhian individ...
Hoabinhian individual, Laos 6012 BCE The Hoabinhian Culture
Reconstructed portrait of Hoabinhian individual, Northern Bolikhamsay. Pha Faen, Laos (6,012-5,837 BCE)
Hoabinhian individual, Laos 6012 BCE The Hoabinhian Culture
Reconstructed portrait of BA individual, Ban Chiang, Thailand (1,200-1,000 BCE)
BA individual, Tha...
BA individual, Thailand 1200 BCE Bronze Age Thailand
Reconstructed portrait of BA individual, Ban Chiang, Thailand (1,200-1,000 BCE)
BA individual, Thailand 1200 BCE Bronze Age Thailand
Reconstructed portrait of Koror Quarry individual, Koror Quarry (Koror Island), Palau (226-574 CE)
Koror Quarry indiv...
Koror Quarry individual, Palau 226 CE
Reconstructed portrait of Koror Quarry individual, Koror Quarry (Koror Island), Palau (226-574 CE)
Koror Quarry individual, Palau 226 CE
Pacific 5.9/100 affinity
Paleolithic 0.5/100 affinity
Bronze Age 0.4/100 affinity
Neolithic 0.0/100 affinity
Iron Age 0.0/100 affinity
Classical 0.0/100 affinity
Maritime 0.0/100 affinity
Through the Ages

Your Southeast Asian and Oceanian Journey Through Time

Each era below represents a chapter of southeast asian and oceanian history

1 connection

Palau KororQuarry 1500BP

Pacific

Region & Environment

The "Palau KororQuarry 1500BP" era refers to archaeological sequences in Palau, an island archipelago in the western Pacific. Palau’s environment is dominated by coastal settings where reefs, lagoons, and nearshore marine habitats would have provided reliable food sources. Freshwater availability and arable soils were more limited than in mainland settings, encouraging close attention to coastal resource zones.


1 Sample
1 Country
~1,800 Years Ago
400 BCE - 700 CE Period
Regions Represented
Palau (1)
1 connection

Laos Hoabinhian

Paleolithic

Region & Environment

Hoabinhian-identified groups in the Laos region lived in the tropical monsoon landscapes of Southeast Asia, where rivers, wetlands, and surrounding forests created diverse foraging opportunities. Environmental conditions changed through the transition from late Pleistocene to early Holocene, affecting the distribution and productivity of aquatic and terrestrial resources.

1 Sample
1 Country
~8,038 Years Ago
12,000 BCE - 2,000 BCE Period
Genetic Signatures
C-K150 1 M5 1
Regions Represented
Laos (1)
1 connection

Thailand BA

BronzeAge

Overview

Thailand BA refers to a long Bronze Age span in mainland Southeast Asia, when local communities increasingly incorporated bronze technologies into both practical and ceremonial spheres. The archaeological record suggests gradual regional development rather than a single, uniform culture.

1 Sample
1 Country
~3,226 Years Ago
1,500 BCE - 500 BCE Period
Genetic Signatures
NO-M214 1 B5a1c 1
Regions Represented
Thailand (1)

"Southeast Asia and Oceania were linked by coastlines, islands, and some of humanity's greatest maritime migrations."

— Ancient Southeast Asia & Oceania
Era Analysis

Your Era Profile

A visual snapshot of fit-weighted genetic similarity to reference samples from different periods of Southeast Asia and Oceania. The further the point from the center, the higher the affinity score within this report.

Your Dominant Era Pacific 5.9/100 affinity
Pacific 5.9/100

Austronesian and Pacific voyaging histories.

Paleolithic 0.5/100

Early populations of Southeast Asia and Sahul.

Bronze Age 0.4/100

Bronze Age communities.

Neolithic 0.0/100

Early farming and Austroasiatic connections.

Iron Age 0.0/100

Iron Age societies.

Classical 0.0/100

Classical-period Southeast Asian states.

Maritime 0.0/100

Maritime exchange across island Southeast Asia.

Understanding Your Era Profile

Your dominant connection to the Pacific suggests that a significant portion of your Southeast Asian and Oceanian ancestry traces back to populations who lived during this transformative period of Southeast Asian and Oceanian history. This doesn't mean your ancient matches were exclusively from this era, rather, it indicates where the strongest genetic signals appear in your connection to ancient Southeast Asian and Oceanian populations.

Genetic Analysis

Your Position in Southeast Asian and Oceanian Genetic Space

Explore a reference-fixed ADMIXTURE projection. The reference map stays identical for every kit using the same report version.

PCA reduces the N-dimensional ADMIXTURE reference panel to selected axes in a shared, reference-fixed ADMIXTURE PCA space. The chart currently shows the selected components. Variance percentages are global to that shared model and are not re-fit per report. Distance and filtering use the original N-dimensional ADMIXTURE values. Your kit is the gold diamond. This is not a Global25/Vahaduo plot.

Closest references in full ADMIXTURE space

This table is the non-visual equivalent of the chart and uses full-dimensional distance rather than apparent 2D spacing.

ReferencePeriodPlace/dateDistance

Composite Score Breakdown

Your Ancient Southeast Asia & Oceania Similarity Index (52/100) is calculated from three weighted components, with segment-level matches carrying the most weight because they are the strongest genetic evidence:

Segment Matching 50%
100/100

Direct DNA segments (identity-by-descent) shared with ancient Southeast Asian and Oceanian individuals, the strongest evidence of a genetic connection.

ADMIXTURE Distance 31.25%
2/100

Euclidean genetic distance between your ADMIXTURE composition and Southeast Asian and Oceanian reference samples.

Monte Carlo 18.75%
7/100

Goodness-of-fit for stochastic modeling against the Southeast Asian and Oceanian reference panel.

Shared DNA Segments

You share DNA segments with 69 ancient Southeast Asian and Oceanian individuals, totalling 1,058.9 cM across 119 segments. These shared segments are the strongest evidence in your Ancient Southeast Asia & Oceania Similarity Index. Segment length is most reliable when backed by dense SNP coverage; matches flagged Low coverage below come from ancient samples with sparse genotyping, so their shared-cM value is less certain even when it looks large.

Reconstructed portrait of Latte individual, Naton Beach Site, Guam (1,305-1,400 CE) 17.8 cM
Latte individual, Guam

Sample ID: I24525

Guam 5 segments · 66.7 SNPs/cM
Reconstructed portrait of Austronesian individual, Efate. Mele-Taplins, Vanuatu (410-210 BCE) 16.3 cM
Austronesian individual, Vanuatu

Sample ID: I4451

Vanuatu 4 segments · 58.1 SNPs/cM
Reconstructed portrait of Latte individual, Naton Beach Site, Guam (1,150-1,350 CE) 18.3 cM
Latte individual, Guam

Sample ID: I24249

Guam 4 segments · 50.1 SNPs/cM
Reconstructed portrait of Northern Mariana Latte Chamoru individual, Northern Mariana Islands. Saipan. Garapan. Best Sunshine Casino site, USA (1,410-1,446 CE) 15.4 cM
Northern Mariana Latte Chamoru individual, USA

Sample ID: I24606

USA 4 segments · 57.0 SNPs/cM
Reconstructed portrait of N EBA individual, North Moluccas. Morotai. Tanjung Pinang, Indonesia (750 BCE-350 CE) 15.1 cM
N EBA individual, Indonesia

Sample ID: TanjungPinang2

Indonesia 4 segments · 56.3 SNPs/cM
Reconstructed portrait of Latte individual, Naton Beach Site, Guam (1,216-1,271 CE) 12.2 cM
Latte individual, Guam

Sample ID: I24259

Guam 3 segments · 64.5 SNPs/cM
Reconstructed portrait of Federated Statesof Micronesia Saudeleur Dynasty individual, Caroline Islands. Pohnpei. Temwen Island. Man Nadol. Peinioar, Federated States of Micronesia (1,400-1,500 CE) 11.6 cM
Federated Statesof Micronesia Saudeleur Dynasty individual, Federated States of Micronesia

Sample ID: I30482

Federated States of Micronesia 3 segments · 61.9 SNPs/cM
Reconstructed portrait of Latte individual, Naton Beach Site, Guam (1,414-1,444 CE) 11.8 cM
Latte individual, Guam

Sample ID: I24518

Guam 3 segments · 56.7 SNPs/cM
Reconstructed portrait of Latte individual, Naton Beach Site, Guam (1,200-1,500 CE) 10.6 cM
Latte individual, Guam

Sample ID: I24242

Guam 3 segments · 62.3 SNPs/cM
Reconstructed portrait of Austronesian individual, Malakula, Vanuatu (163 BCE-19 CE) 17.0 cM
Austronesian individual, Vanuatu

Sample ID: MAL007

Vanuatu 3 segments · 41.5 SNPs/cM
Reconstructed portrait of Melanesian individual, Epi Island. Burumbe, Vanuatu (580-710 CE) 9.1 cM
Melanesian individual, Vanuatu

Sample ID: I4096

Vanuatu 2 segments · 59.9 SNPs/cM
Reconstructed portrait of Northern Mariana Latte Chamoru individual, Northern Mariana Islands. Saipan. Garapan. Best Sunshine Casino site, USA (1,397-1,437 CE) 8.1 cM
Northern Mariana Latte Chamoru individual, USA

Sample ID: I24593

USA 2 segments · 65.8 SNPs/cM
Haplogroup Evolution

Haplogroup Distribution Across Southeast Asian and Oceanian History

Explore how Y-DNA and mtDNA haplogroups changed across different periods of Southeast Asian and Oceanian history.

0
Total Samples
0
Cultural Periods
0
Unique Haplogroups

Neolithic

20 samples
O-F2028 2
20.0%
Reconstructed portrait of Austroasiatic individual, Man Bac, Vietnam (1,872-1,636 BCE) Austroasiatic individual, Vietnam Sample ID: I2731 Man Bac
Reconstructed portrait of LN BA IA individual, Sumatra. Northwest Aceh. Loyang Ujung Cave, Indonesia (353-57 BCE) LN BA IA individual, Indonesia Sample ID: In662 Sumatra. Northwest Aceh. Loyang Ujung Cave
Vietnam Indonesia
O-CTS2483 1
10.0%
Reconstructed portrait of Austroasiatic individual, Man Bac, Vietnam (2,200-1,600 BCE) Austroasiatic individual, Vietnam Sample ID: I0626 Man Bac
Vietnam
CT-M168 1
10.0%
Reconstructed portrait of N individual, Man Bac, Vietnam (1,876-1,687 BCE) N individual, Vietnam Sample ID: I1135 Man Bac
Vietnam
O-F3386 1
10.0%
Reconstructed portrait of Austroasiatic individual, Man Bac, Vietnam (1,882-1,742 BCE) Austroasiatic individual, Vietnam Sample ID: I1137 Man Bac
Vietnam
O-CTS3106 1
10.0%
Reconstructed portrait of Austroasiatic individual, Man Bac, Vietnam (2,200-1,600 BCE) Austroasiatic individual, Vietnam Sample ID: I2726 Man Bac
Vietnam
O-B426 1
10.0%
Reconstructed portrait of LN BA individual, Northeast Huapan. Tam Pa Ping, Laos (1,125-926 BCE) LN BA individual, Laos Sample ID: La364 Northeast Huapan. Tam Pa Ping
Laos
O-FGC29900 1
10.0%
Reconstructed portrait of Austronesian individual, West Peninsular Kelantan. Gua Cha Cave, Malaysia (744-398 BCE) Austronesian individual, Malaysia Sample ID: Ma912 West Peninsular Kelantan. Gua Cha Cave
Malaysia
O-Y241664 1
10.0%
Reconstructed portrait of N individual, North Moluccas. Kayoa. Gua Uattamdi, Indonesia (30-210 CE) N individual, Indonesia Sample ID: Uattamdi1 North Moluccas. Kayoa. Gua Uattamdi
Indonesia
O-F314 1
10.0%
Reconstructed portrait of Southeast Asian Neolithic individual, Northwest Lai Châu. Nam Tun, Vietnam (800-551 BCE) Southeast Asian Neolithic individual, Vietnam Sample ID: Vt778 Northwest Lai Châu. Nam Tun
Vietnam

Neolithic

20 samples
M7b1a1 3
20.0%
Reconstructed portrait of Austroasiatic individual, Man Bac, Vietnam (2,133-1,892 BCE) Austroasiatic individual, Vietnam Sample ID: I0627 Man Bac
Reconstructed portrait of N individual, Man Bac, Vietnam (1,876-1,687 BCE) N individual, Vietnam Sample ID: I1135 Man Bac
Reconstructed portrait of Austroasiatic individual, Man Bac, Vietnam (1,882-1,742 BCE) Austroasiatic individual, Vietnam Sample ID: I1137 Man Bac
Vietnam
F1a1a1 3
20.0%
Reconstructed portrait of Austroasiatic individual, Man Bac, Vietnam (2,200-1,600 BCE) Austroasiatic individual, Vietnam Sample ID: I2726 Man Bac
Reconstructed portrait of LN BA individual, Northeast Huapan. Tam Pa Ping, Laos (1,125-926 BCE) LN BA individual, Laos Sample ID: La364 Northeast Huapan. Tam Pa Ping
Reconstructed portrait of Southeast Asian Neolithic individual, Northwest Lai Châu. Nam Tun, Vietnam (800-551 BCE) Southeast Asian Neolithic individual, Vietnam Sample ID: Vt778 Northwest Lai Châu. Nam Tun
Vietnam Laos
M20 2
13.3%
Reconstructed portrait of LN BA IA individual, Sumatra. Northwest Aceh. Loyang Ujung Cave, Indonesia (353-57 BCE) LN BA IA individual, Indonesia Sample ID: In662 Sumatra. Northwest Aceh. Loyang Ujung Cave
Reconstructed portrait of LN individual, Northern Thanh Hoa. Mai Da Dieu, Vietnam (2,343-2,049 BCE) LN individual, Vietnam Sample ID: Vt833 Northern Thanh Hoa. Mai Da Dieu
Indonesia Vietnam
B5a1a 1
6.7%
Reconstructed portrait of Austroasiatic individual, Man Bac, Vietnam (2,200-1,600 BCE) Austroasiatic individual, Vietnam Sample ID: I0626 Man Bac
Vietnam
M13b 1
6.7%
Reconstructed portrait of Austroasiatic individual, Man Bac, Vietnam (1,889-1,742 BCE) Austroasiatic individual, Vietnam Sample ID: I1859 Man Bac
Vietnam
M74b 1
6.7%
Reconstructed portrait of Austroasiatic individual, Man Bac, Vietnam (1,872-1,636 BCE) Austroasiatic individual, Vietnam Sample ID: I2731 Man Bac
Vietnam
M7b 1
6.7%
Reconstructed portrait of Austroasiatic individual, Man Bac, Vietnam (2,200-1,600 BCE) Austroasiatic individual, Vietnam Sample ID: I2947 Man Bac
Vietnam
F1a1a 1
6.7%
Reconstructed portrait of LN BA IA individual, Sumatra. Northwest Aceh. Loyang Ujung Cave, Indonesia (30-209 CE) LN BA IA individual, Indonesia Sample ID: In661 Sumatra. Northwest Aceh. Loyang Ujung Cave
Indonesia
M17a 1
6.7%
Reconstructed portrait of N individual, East Nusa Tengara. Flores. Liang Bua, Indonesia (1,250-1,300 CE) N individual, Indonesia Sample ID: LIA001002 East Nusa Tengara. Flores. Liang Bua
Indonesia
M13c 1
6.7%
Reconstructed portrait of Austronesian individual, West Peninsular Kelantan. Gua Cha Cave, Malaysia (744-398 BCE) Austronesian individual, Malaysia Sample ID: Ma912 West Peninsular Kelantan. Gua Cha Cave
Malaysia

These distributions show the frequency of Y-DNA and mtDNA haplogroups among all ancient Southeast Asian and Oceanian samples from each cultural period. Haplogroup frequencies changed over time due to migrations, population movements, and genetic drift.

AI Analysis

Your Personal Guide

Understanding ancient DNA results can be complex. Our AI assistant helps you make sense of your connections, explaining what your results mean and placing them in historical context.

AI ASSISTANT by DNAGENICS

Enabled until 2027-09-15

This AI analysis is limited to your Ancient Southeast Asia & Oceania genetic-similarity results. AI output is inferential and is not proof of ancestry or direct descent.

Try these questions:

Learn More

Understanding Your Results

This report uses a three-component genetic-similarity scoring system:

  • Segment Matching (50%): coverage-aware IBD evidence shared with reference individuals.
  • ADMIXTURE Distance (31.25%): Euclidean distance in the original 15-dimensional ADMIXTURE space.
  • Monte Carlo Fit (18.75%): goodness-of-fit against this report's selected reference panel.

The PCA is fitted once from reference samples only. Your kit is projected afterward, so it cannot move the map. The selected two axes omit some variation; use the full-space distance table for nearest-reference comparisons.

What does the Ancient Southeast Asia & Oceania Heritage Index mean?

The Ancient Southeast Asia & Oceania Heritage Index (0-100) represents your overall genetic similarity to ancient Southeast Asian and Oceanian populations. Higher scores indicate closer genetic proximity.

Why don't my cultural-period scores add up to 100?

They are fit-weighted affinity scores, not ancestry percentages. Each conditional period share is multiplied by the overall Monte Carlo fit, so the period scores add up to that model-fit score.

Can I compare this chart with Global25 or another regional report?

No. This is a fixed ADMIXTURE projection for this report's reference panel. You can compare kits within the same report and projection version, but not coordinates across regions or with Vahaduo/Global25.

What counts as a matched sample in Sample Explorer?

A matched sample is a reference individual included in your regional Monte Carlo admixture fit (statistical genetic similarity to this report's panel). When identity-by-descent data is available, Shared Segments shows segment evidence. The table is sorted by strongest segment evidence first (coverage-weighted shared SNPs); fit-only matches without segment data follow afterward.

Exploring Demo Data This is a live preview using sample data. Unlock your full report with your own results.
Demo Mode
Use code for 35% off Expires Sep 16